Left panel
The left panel stacks the experiment’s controls. Every card collapses individually with the button in its header, and the panel itself can be resized by dragging its inner edge, useful when a metadata list gets long.
Runs Management
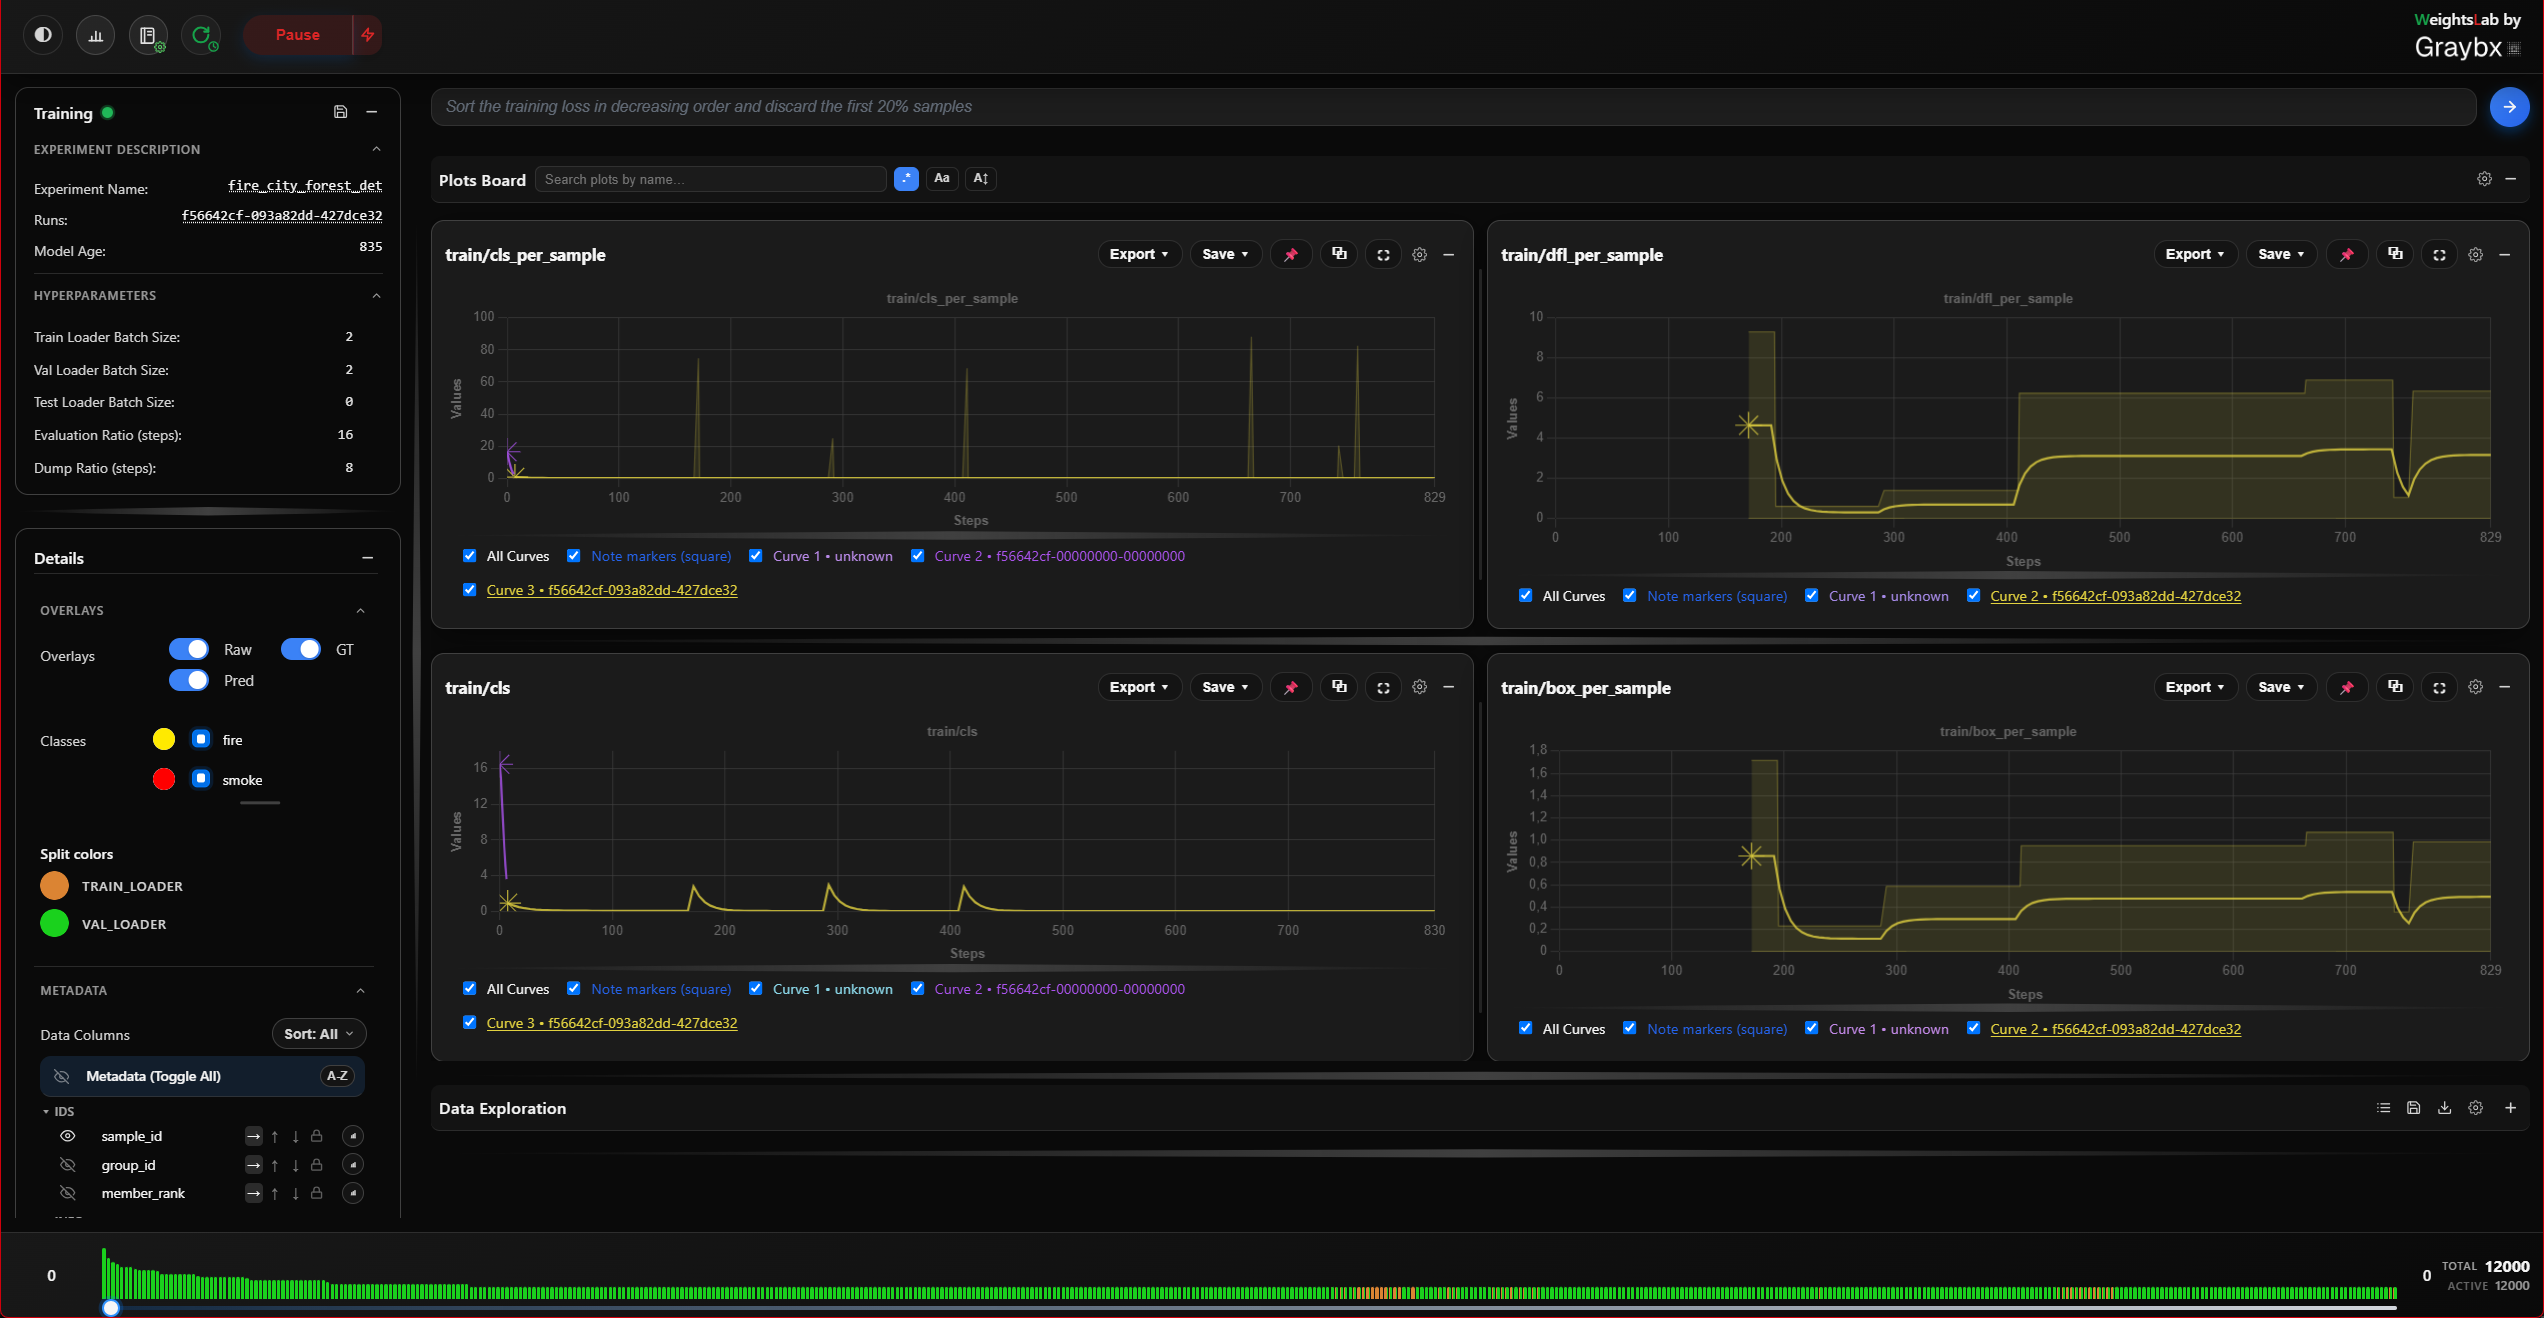
The state pill (training / paused), the backend connection status, and the live metrics for the current step. Below it, the experiment description gives the run’s name, its configuration hash, and its age, the fastest way to confirm the tab you’re looking at is the run you think it is.
The header bar, above the boards, carries the rest of the session-wide run controls:
Training: Pause and Resume
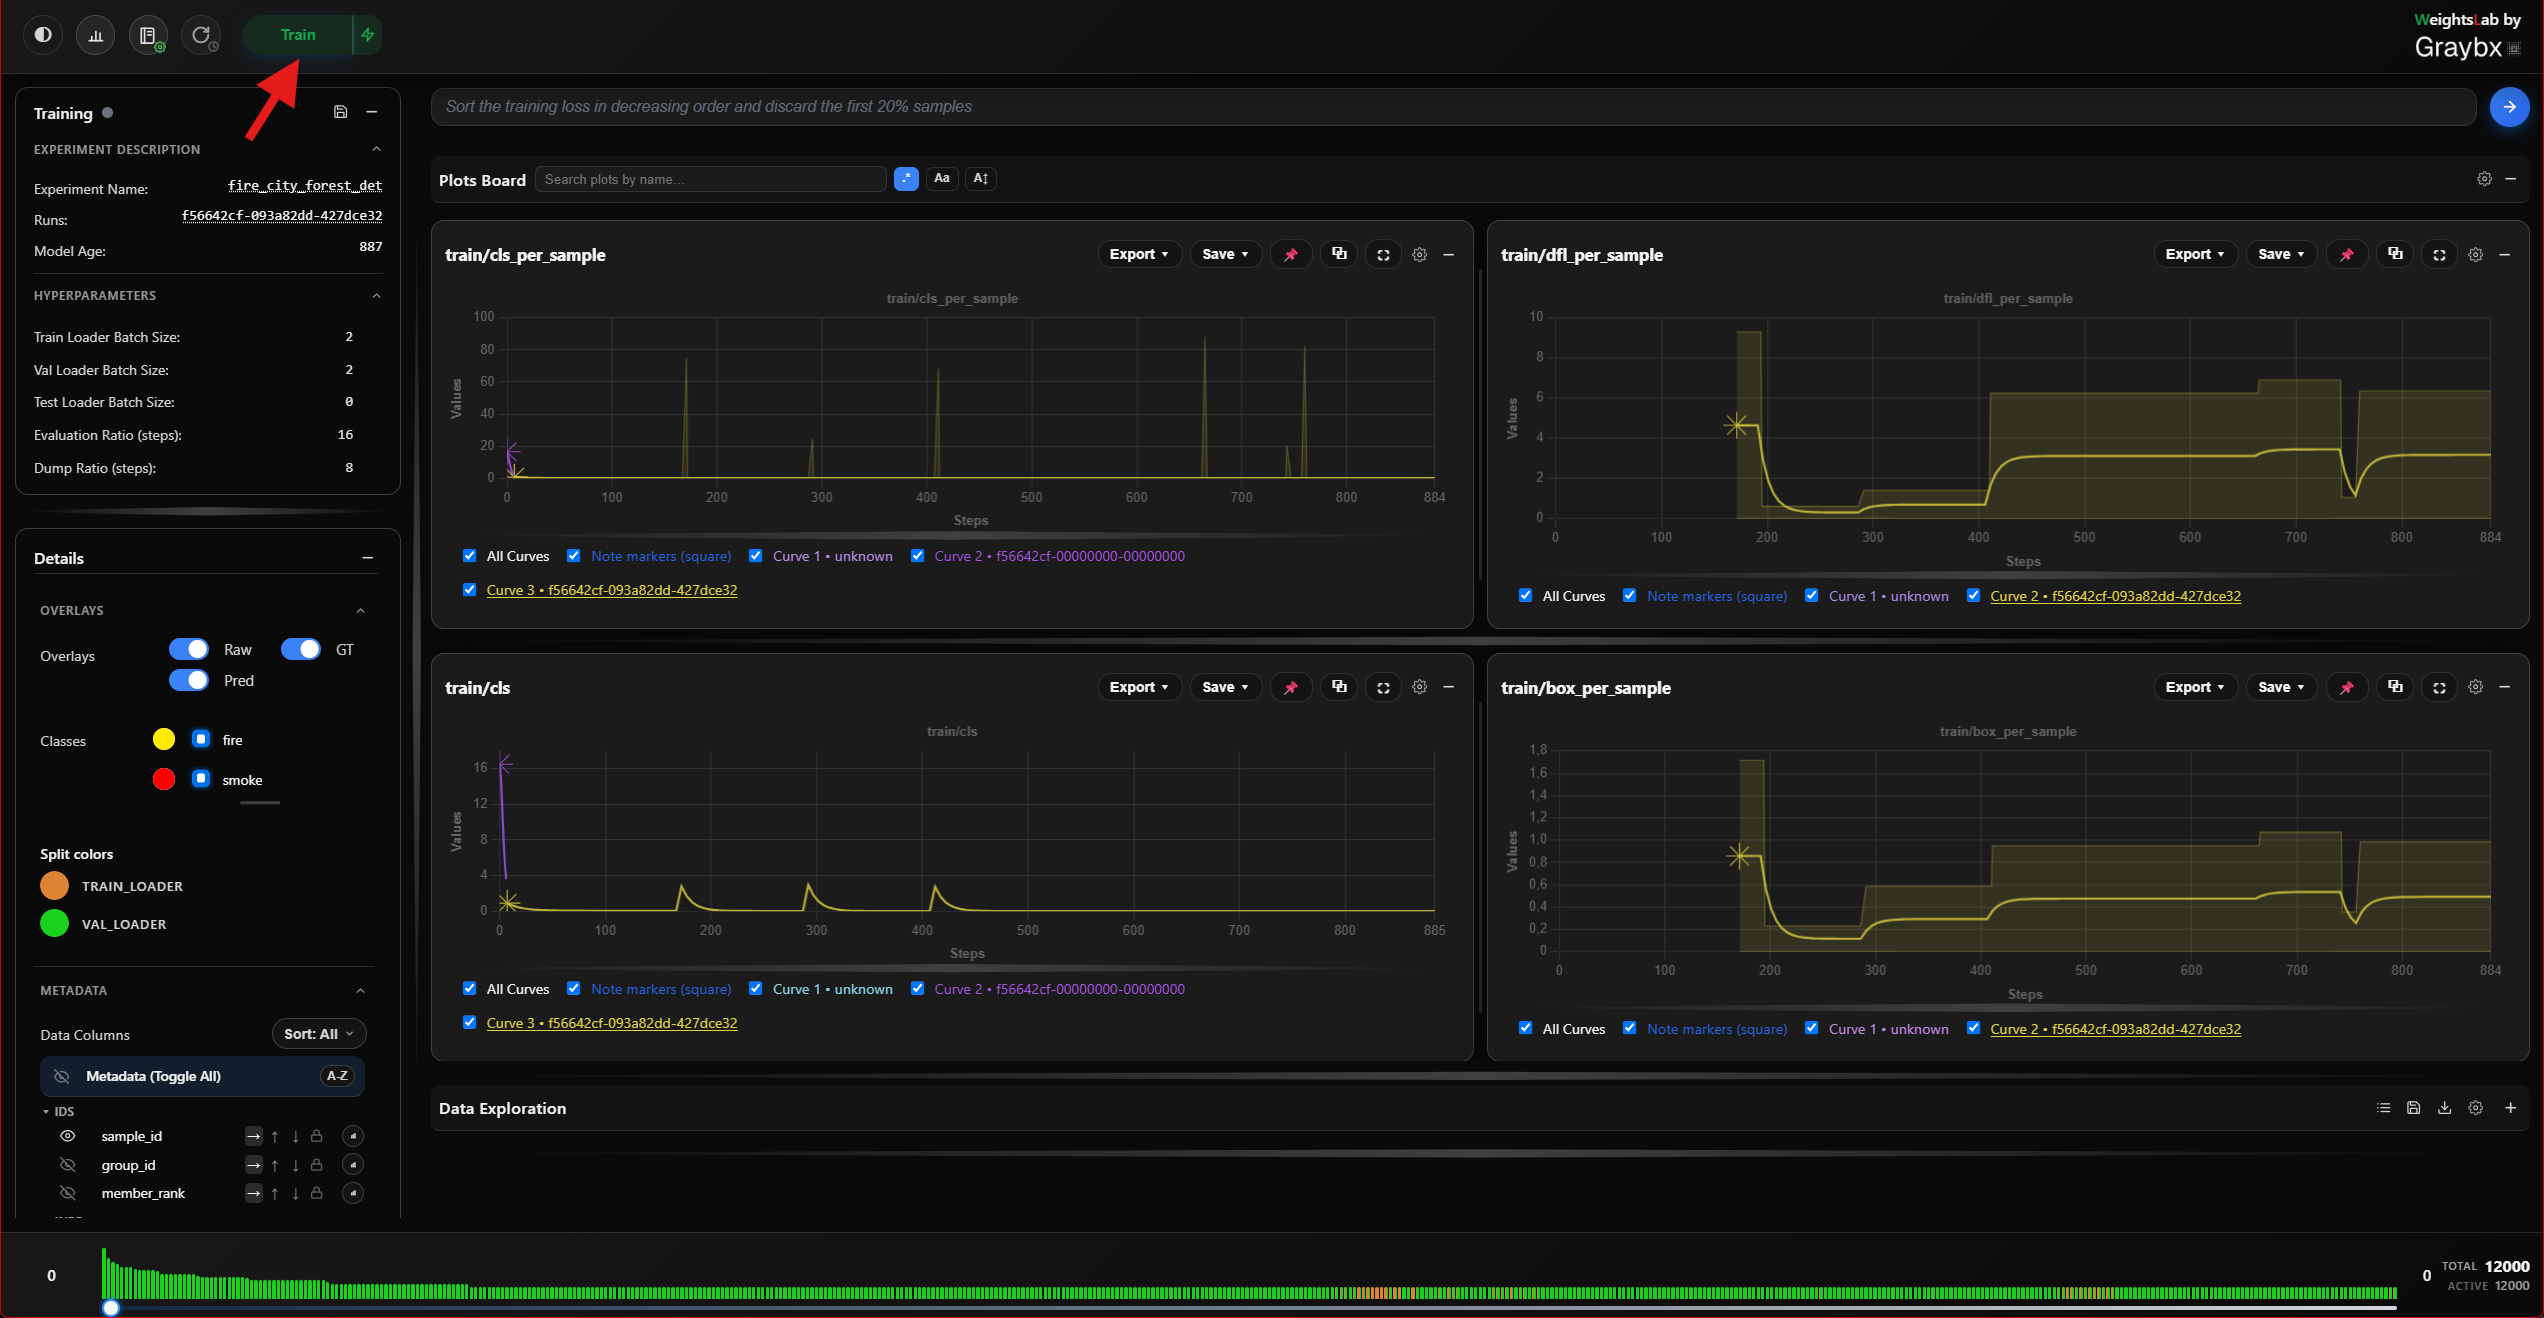
Toggles is_training on the backend. Pausing stops the training loop but
leaves the process, the notebook kernel and the agent alive, this is the
correct way to stop for a while (see Training loop).
Next to it, the save-weights button pauses training and forces a checkpoint dump. Right-click it to also save the architecture alongside the weights.
Tip
Data-modifying actions (discarding, retagging, editing hyperparameters) pause training automatically before they apply, then resume. You don’t have to pause by hand first.
Run Evaluation
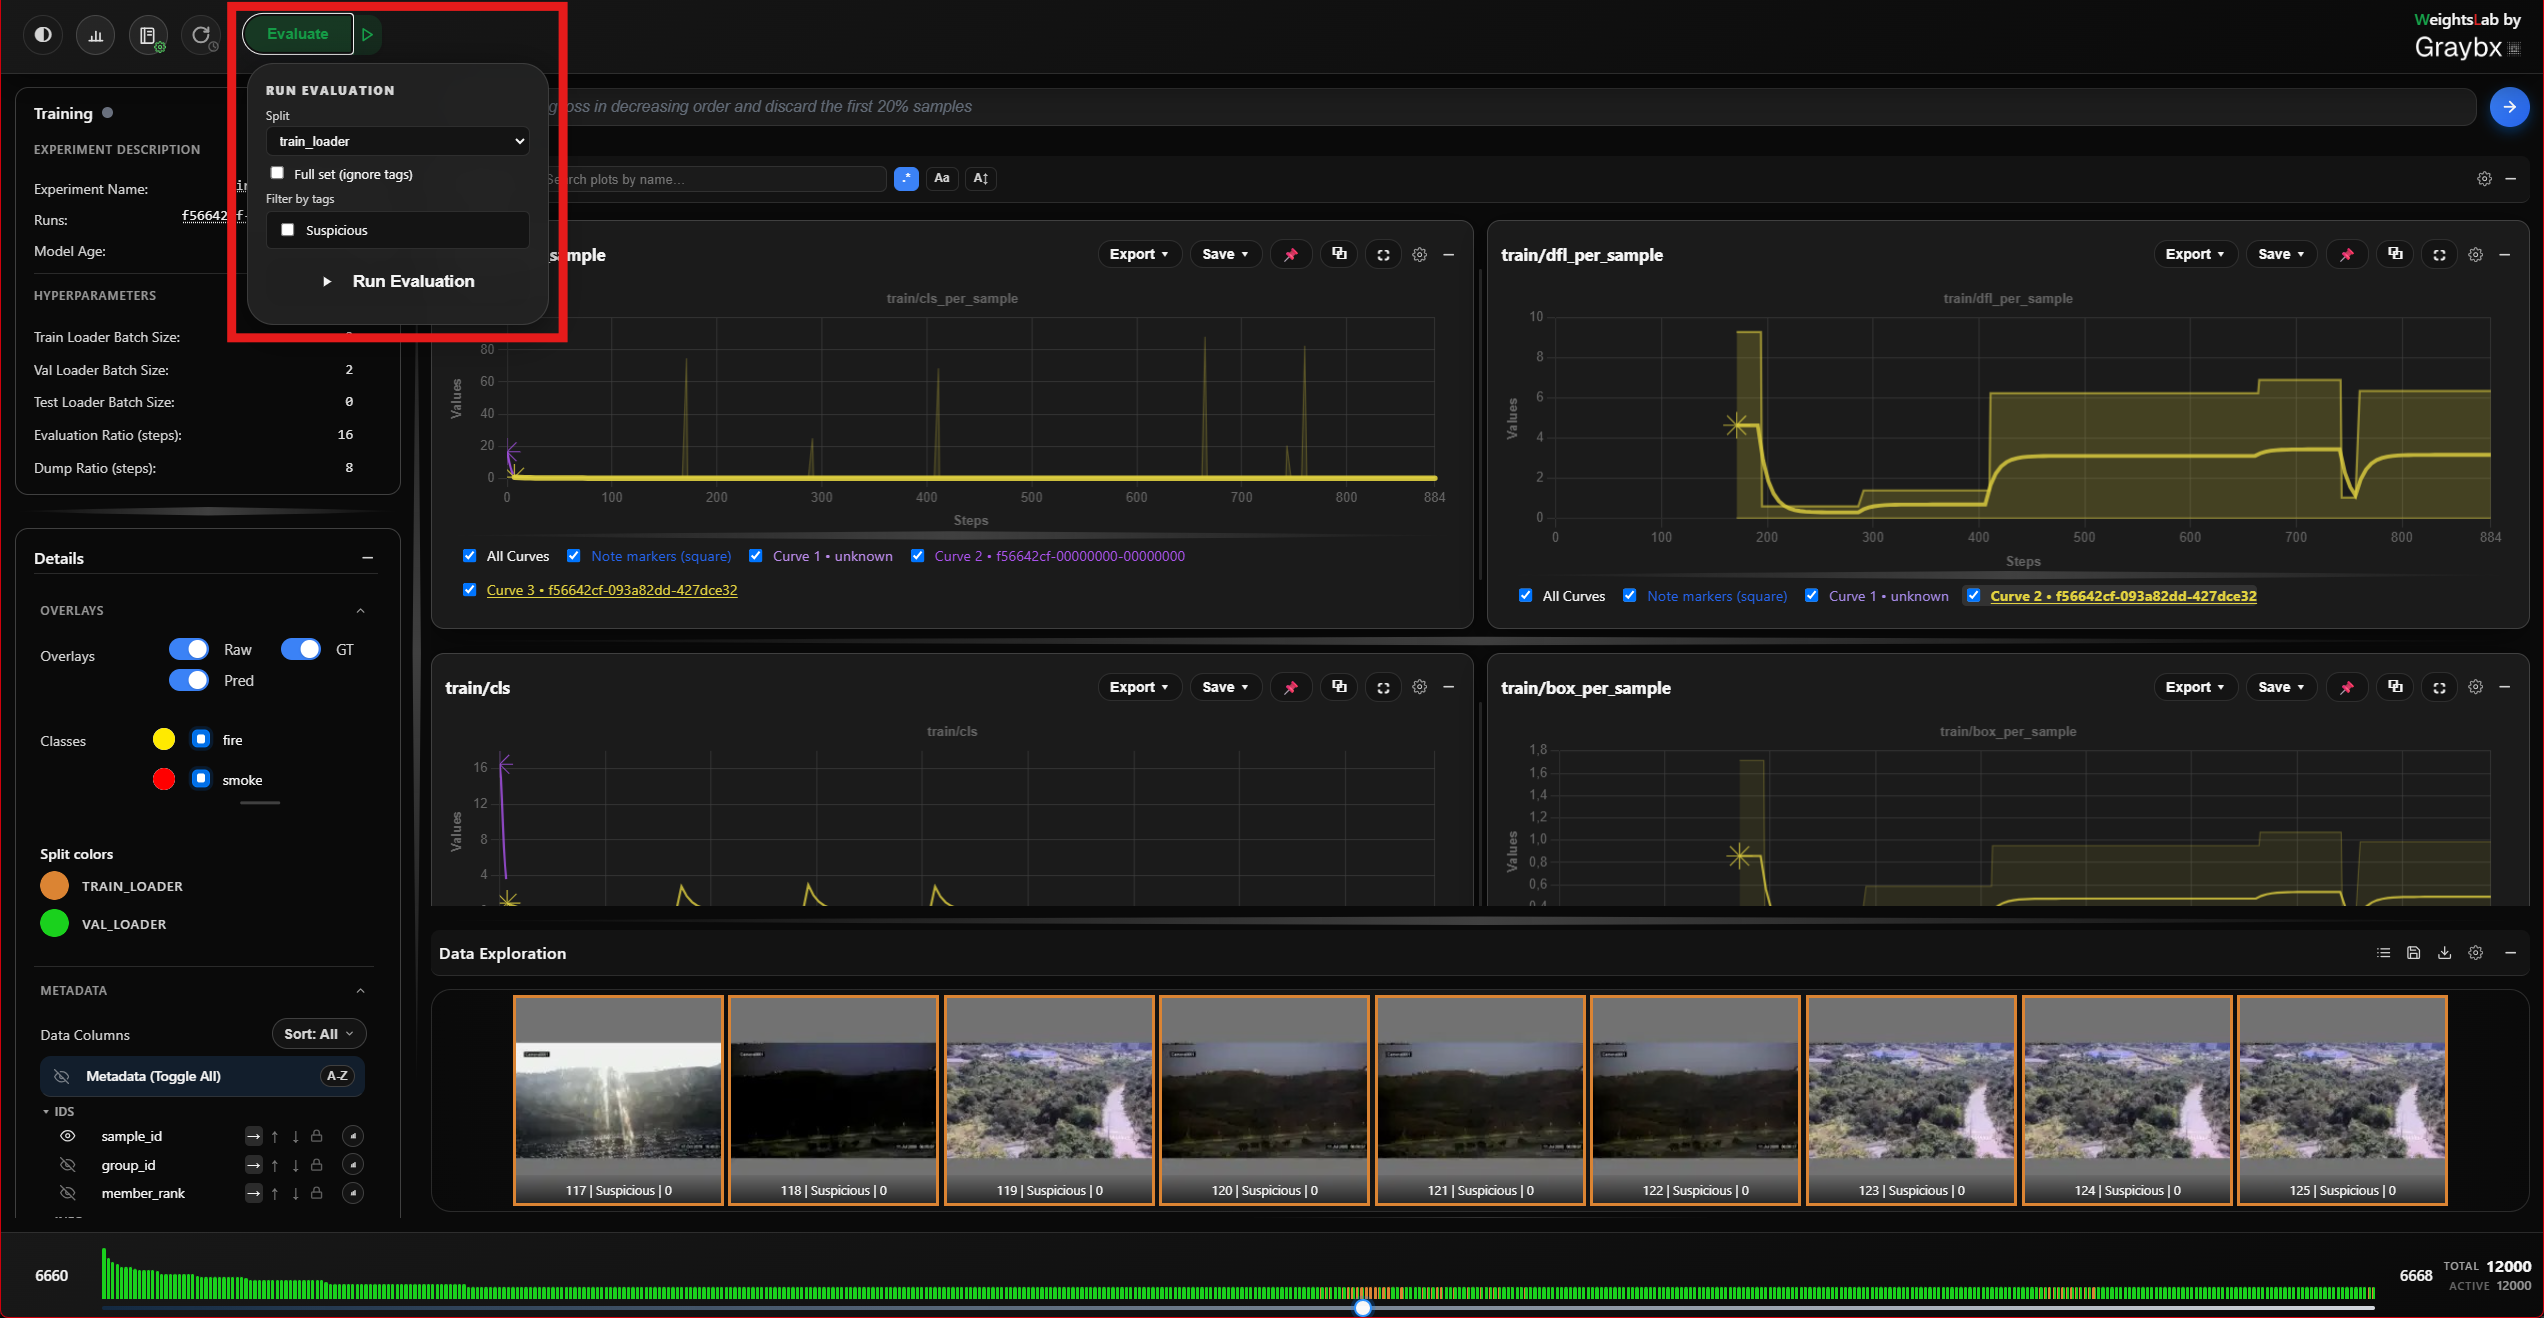
Triggers an evaluation pass on demand:
Pick the split,
train_loaderortest_loader.Either leave Full set (ignore tags) checked, or uncheck it and pick the tags to restrict the pass to a subset.
Click Run Evaluation. A status line reports progress and completion.
Evaluating a tagged subset is the fast path for “did my fix actually help the samples I flagged?”, tag the bad ones, run eval on just that tag, compare.
Mode selector: train / audit / eval
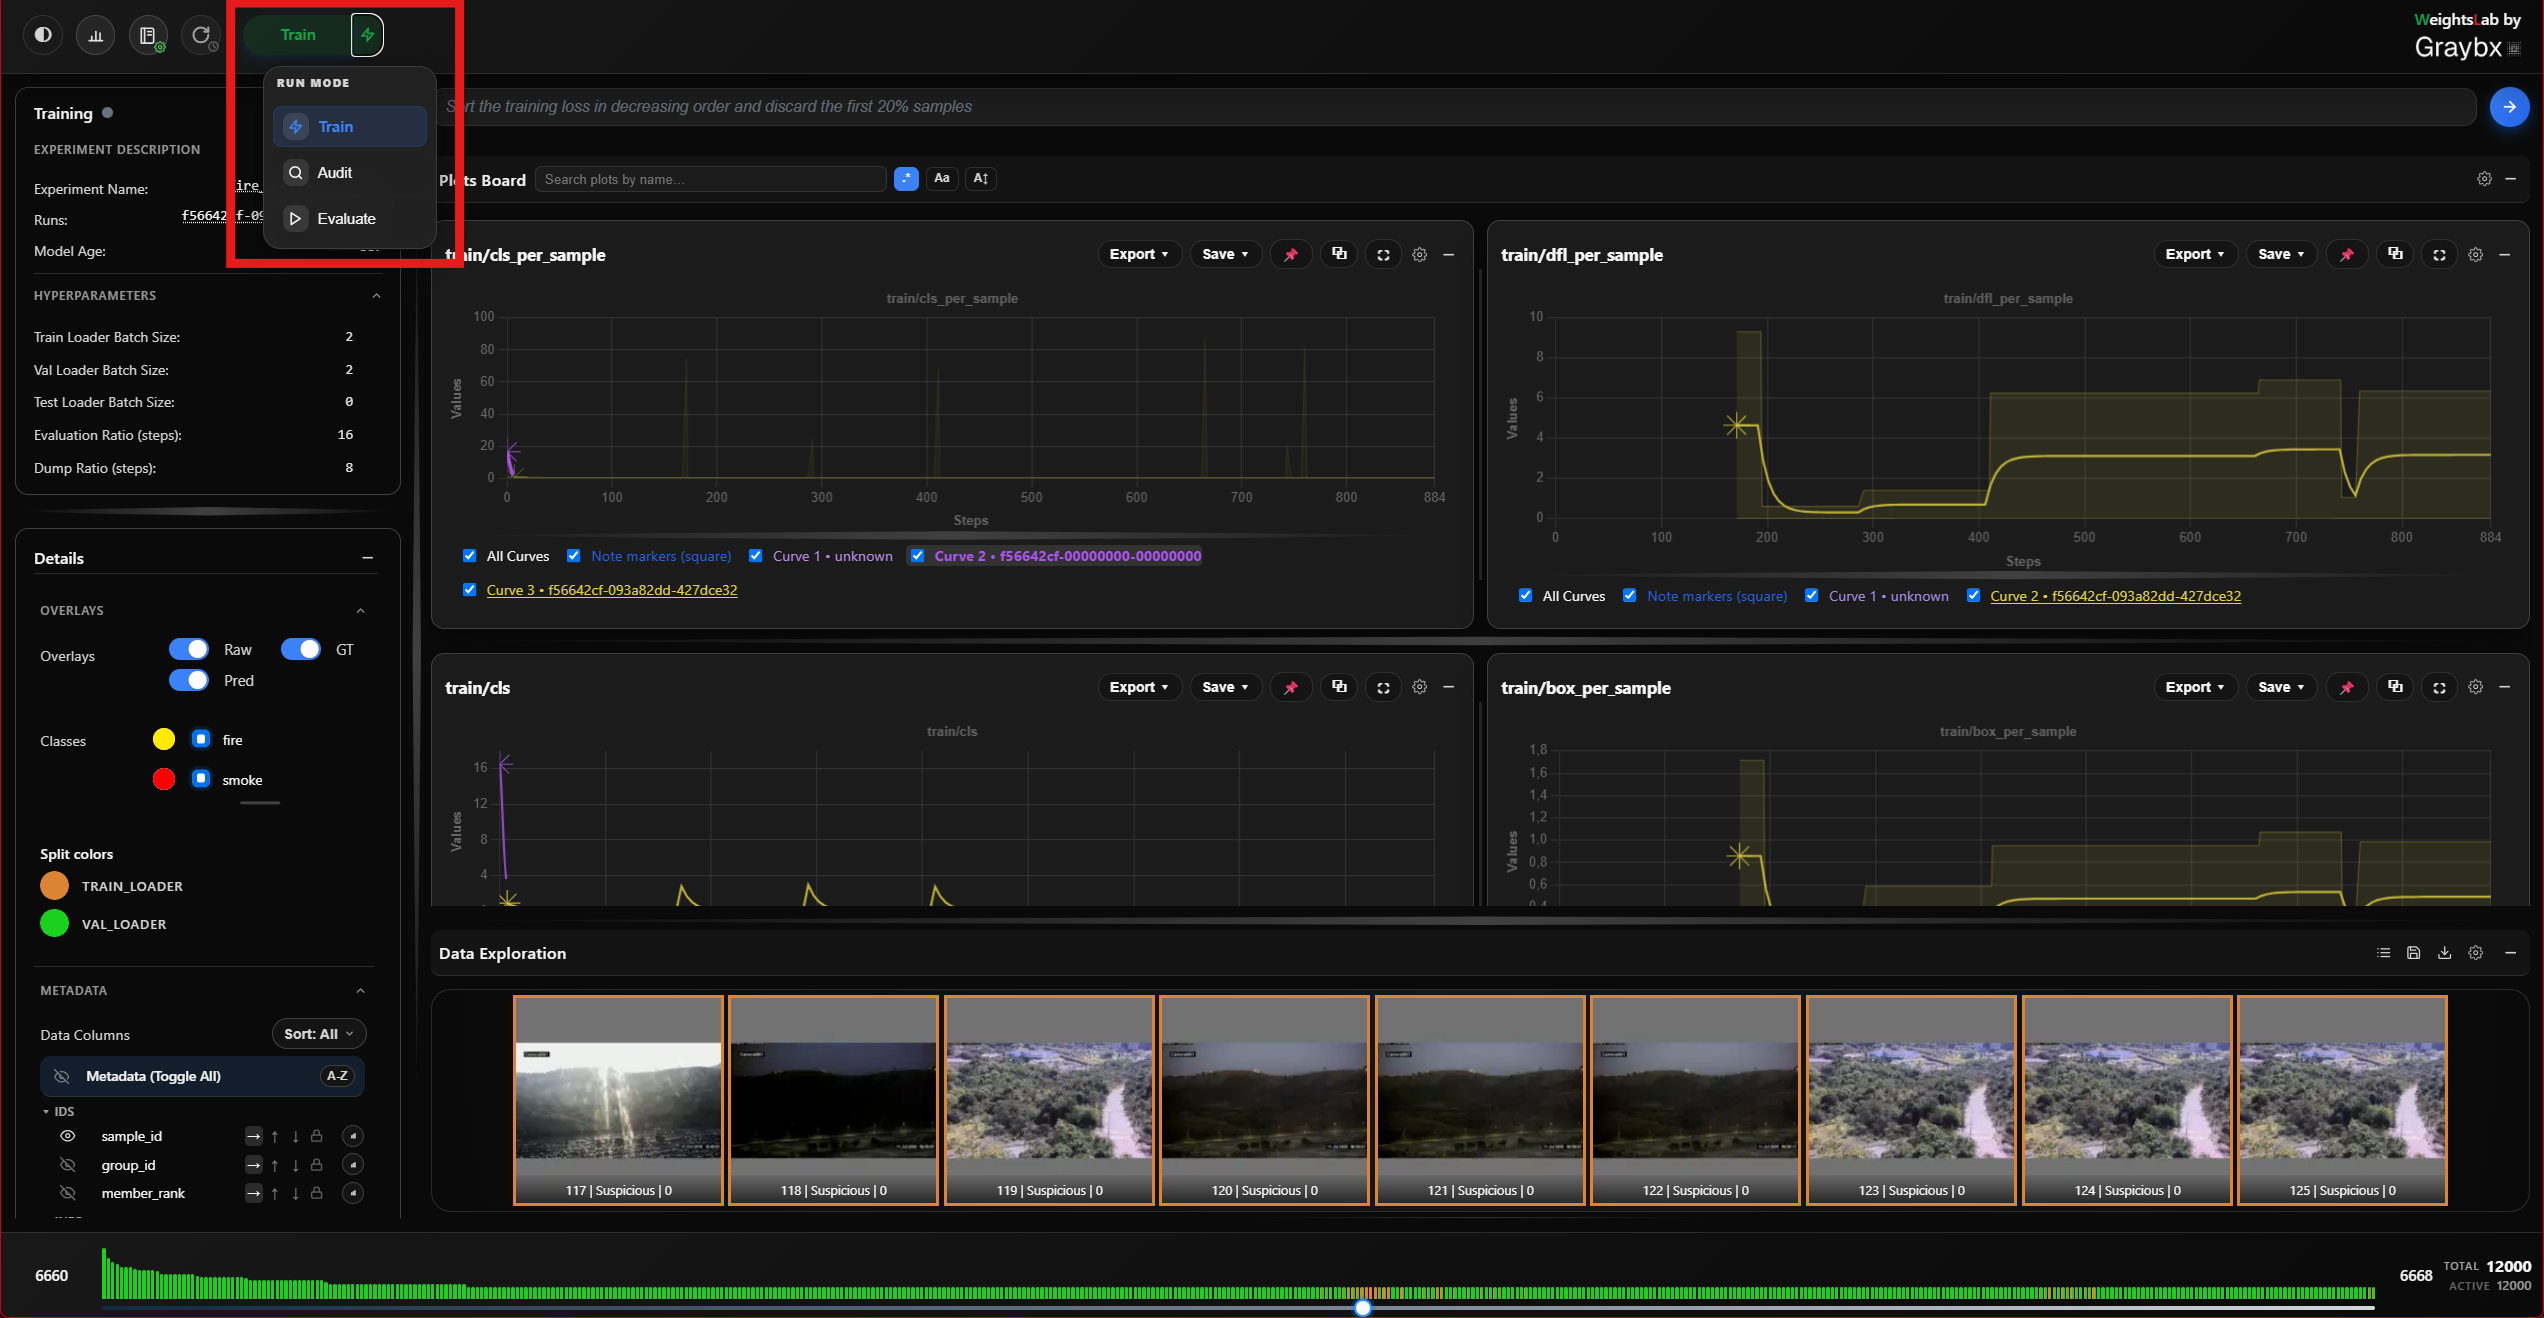
train, the normal loop.
audit, inspect-only; data edits are recorded for review rather than applied blind.
eval, the evaluation pass configured above.
Auto-refresh and cache
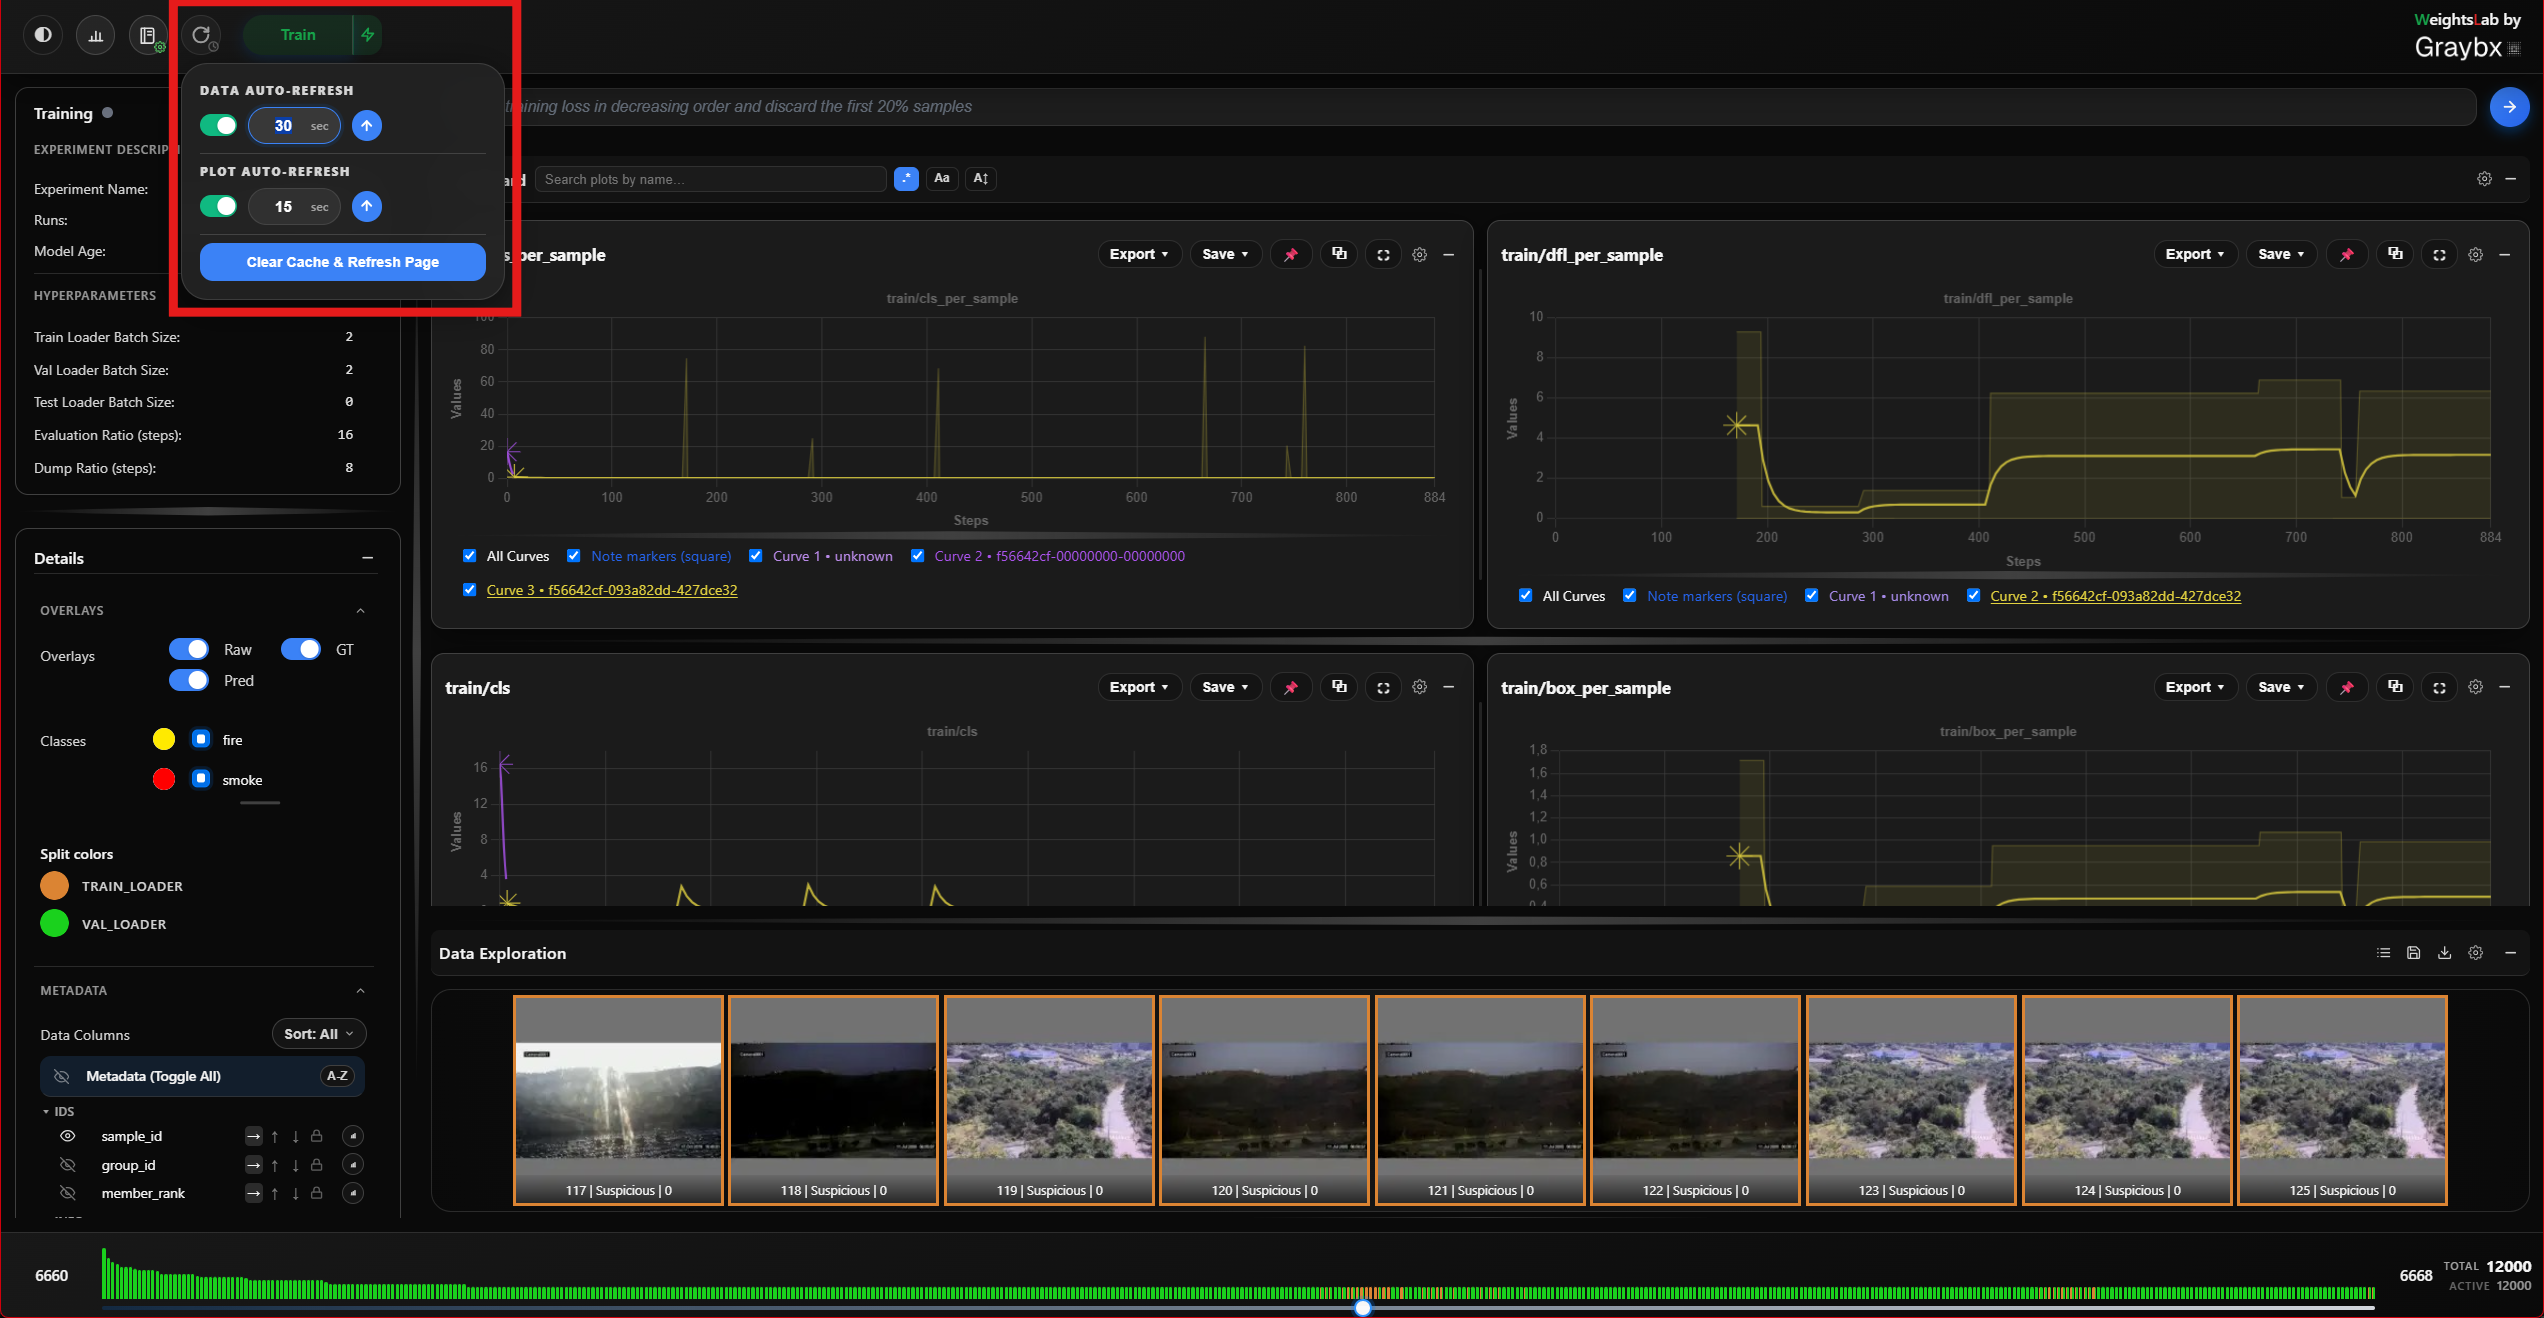
Refresh now re-pulls the stats for the currently visible grid cells. The popover next to it configures the two refresh loops independently:
Data auto-refresh, on/off plus an interval, for the grid and its stats.
Plot auto-refresh, on/off plus an interval, for the signal plots.
Clear cache and reload, drops cached images and metadata, then reloads the page. Reach for this when thumbnails look stale after a data edit.
On a large dataset, turning data auto-refresh off while you work through a selection keeps the grid from re-fetching under you.
Dark mode
Switches the whole studio between light and dark themes. The choice persists across reloads.
Hyperparameters modification in-training
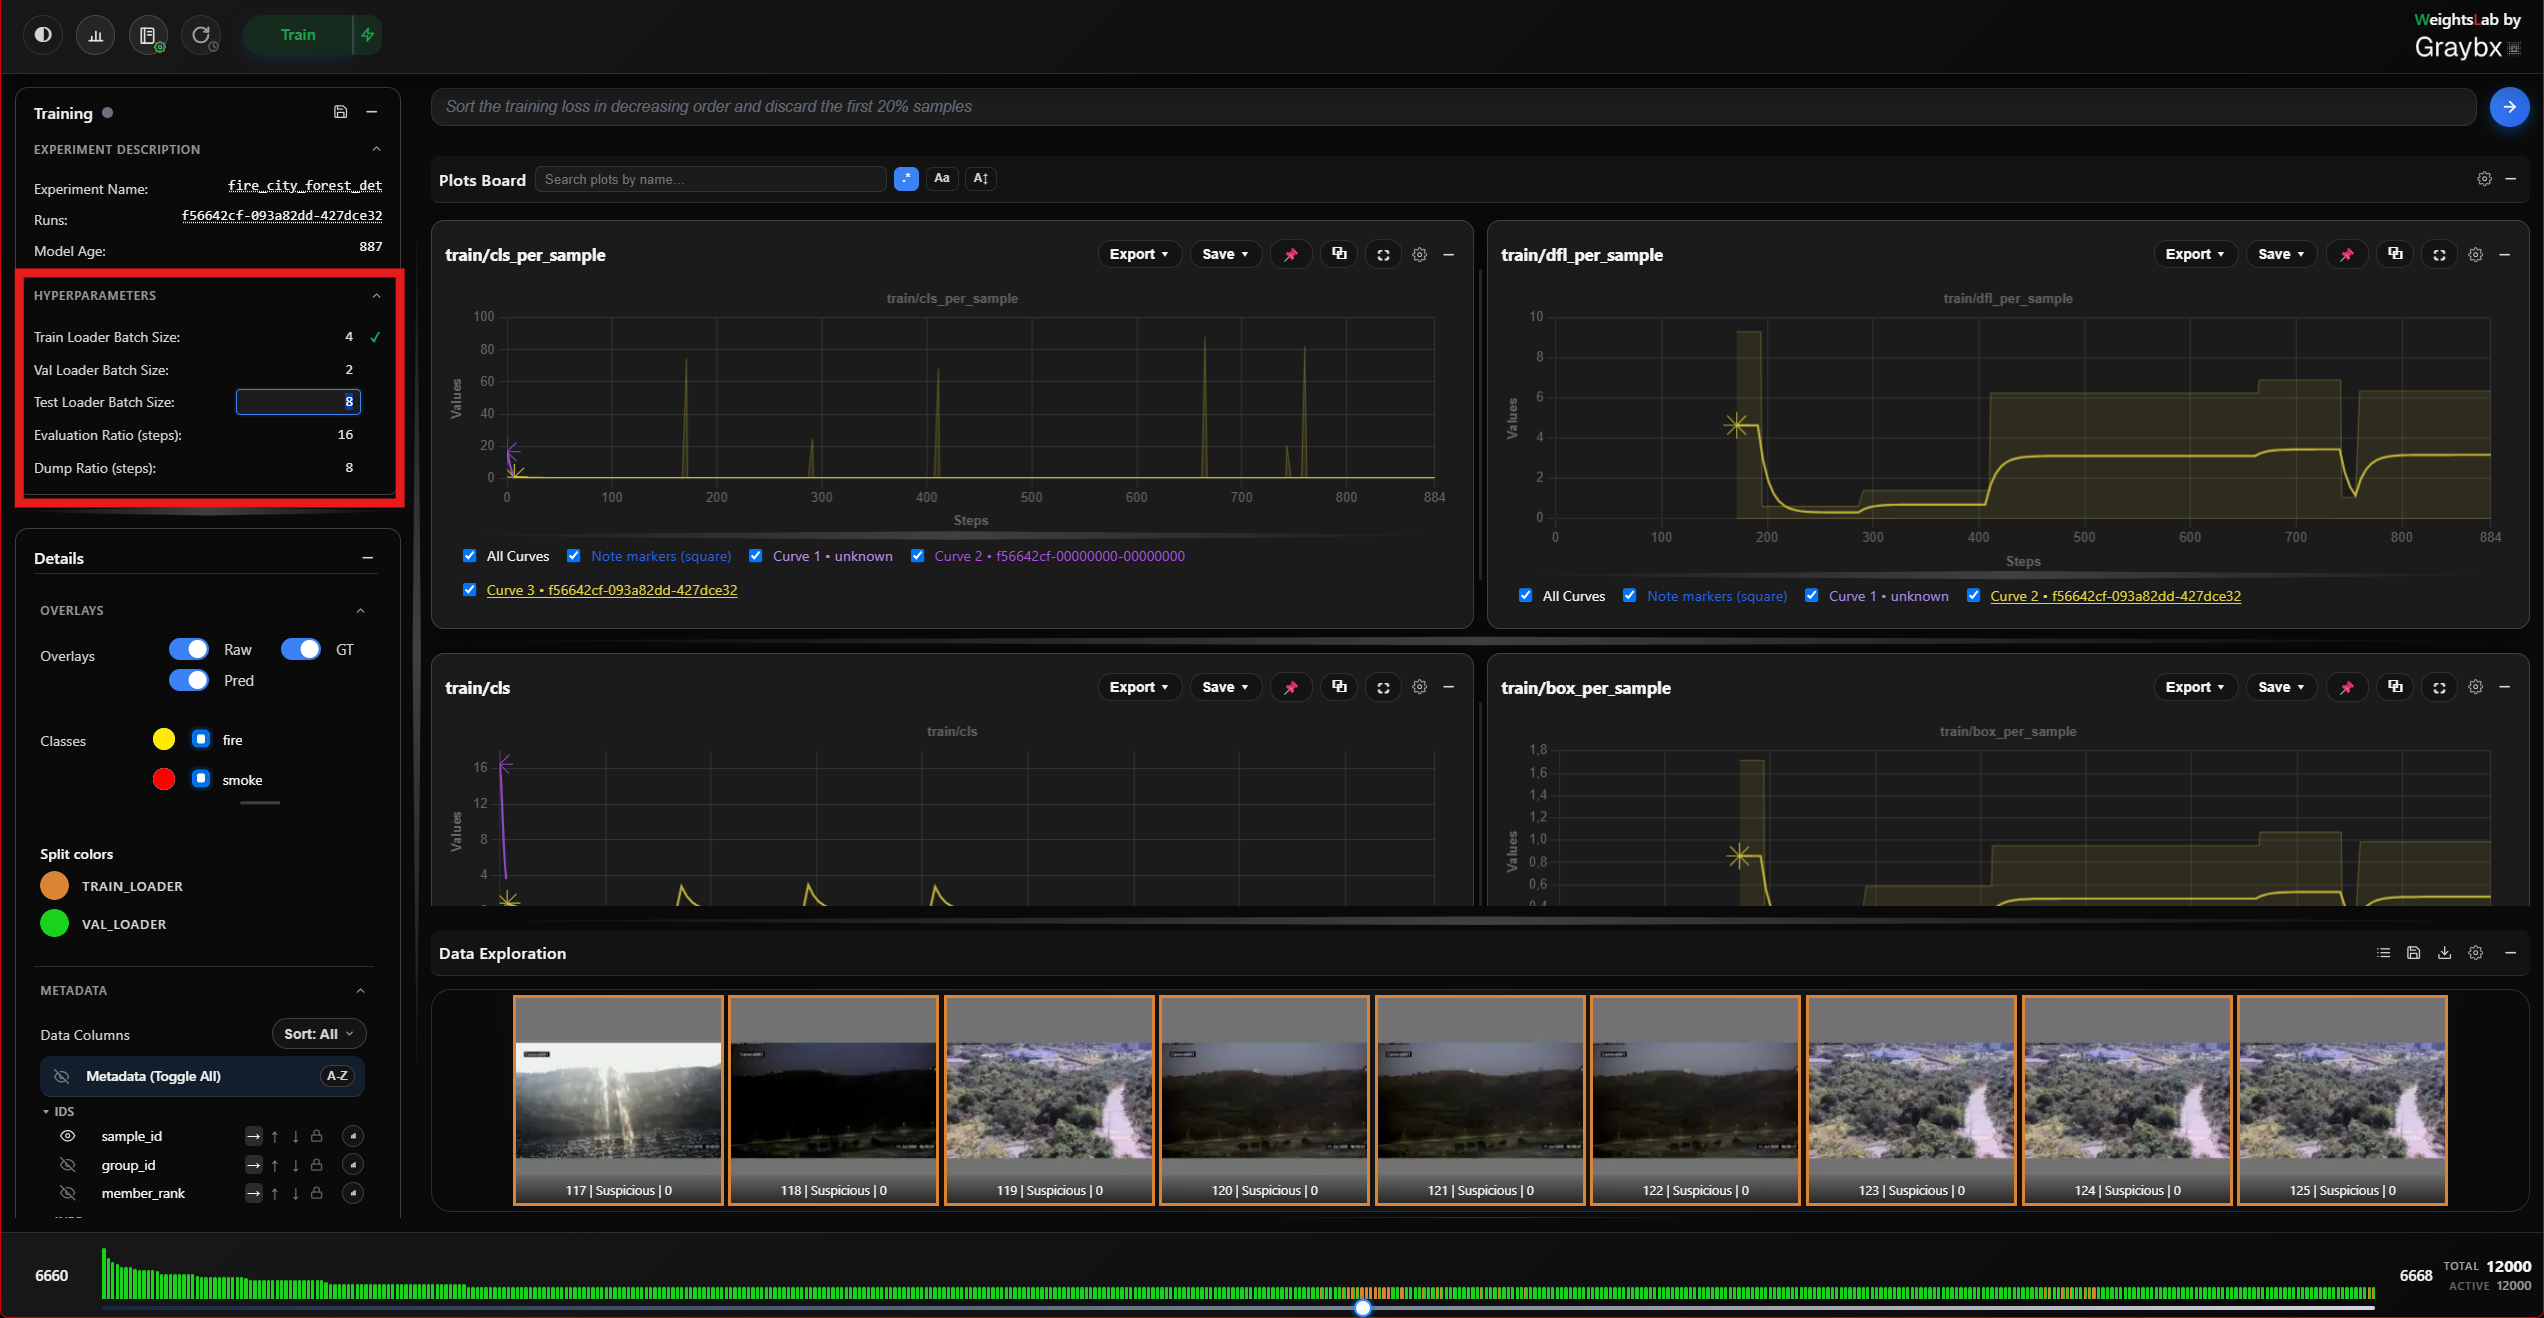
Live, editable hyperparameters, training batch size, validation and test batch sizes, learning rate, evaluation frequency, and checkpoint frequency. Each row shows the requested value next to the applied one, so you can see a change land rather than assume it did.
Edits take effect on the running experiment. Set
ENABLE_HYPERPARAMETERS_OPTIMIZATION=0 to render them read-only.
Painting mode for tag
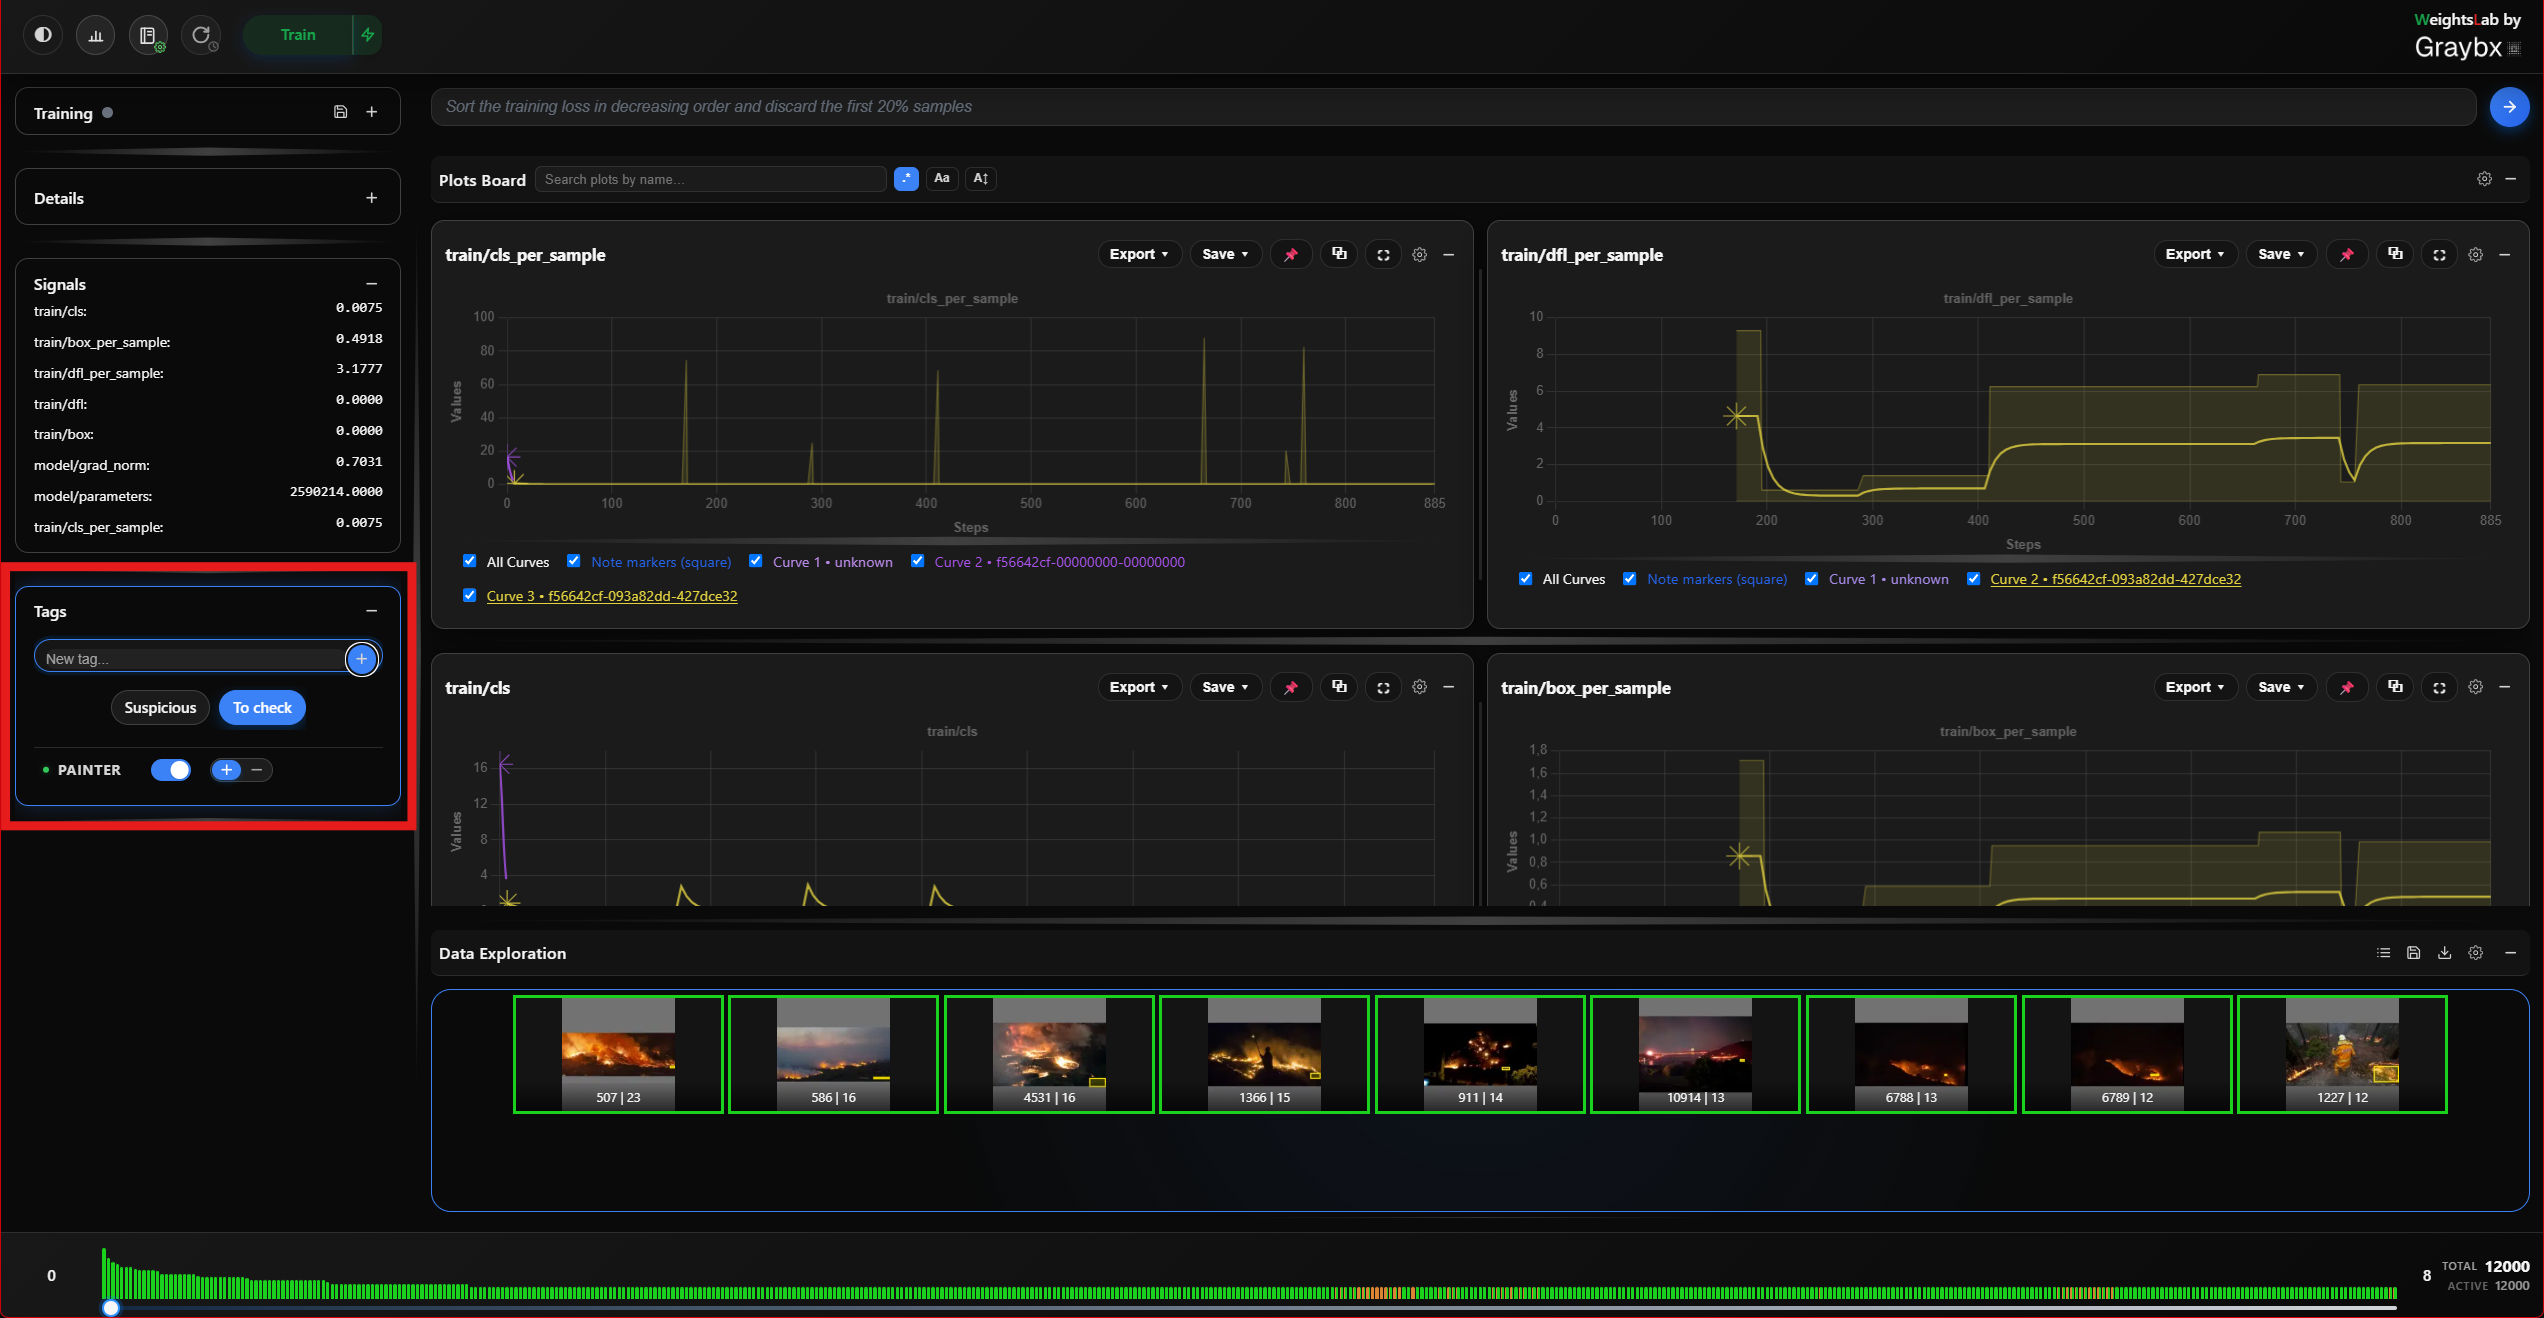
Create tags, then apply them to samples. Two ways:
Selection-based, select cells in the grid, right-click, apply a tag.
Painter mode, toggle the painter, pick a tag chip, then click or drag across grid cells to paint the tag straight onto them. The Add / Remove switcher decides whether painting applies or strips the tag.
Painter mode is what makes labelling a few hundred samples by eye tolerable: no modal, no round trip, just drag.
Metadata Sorting / Hist. Generation
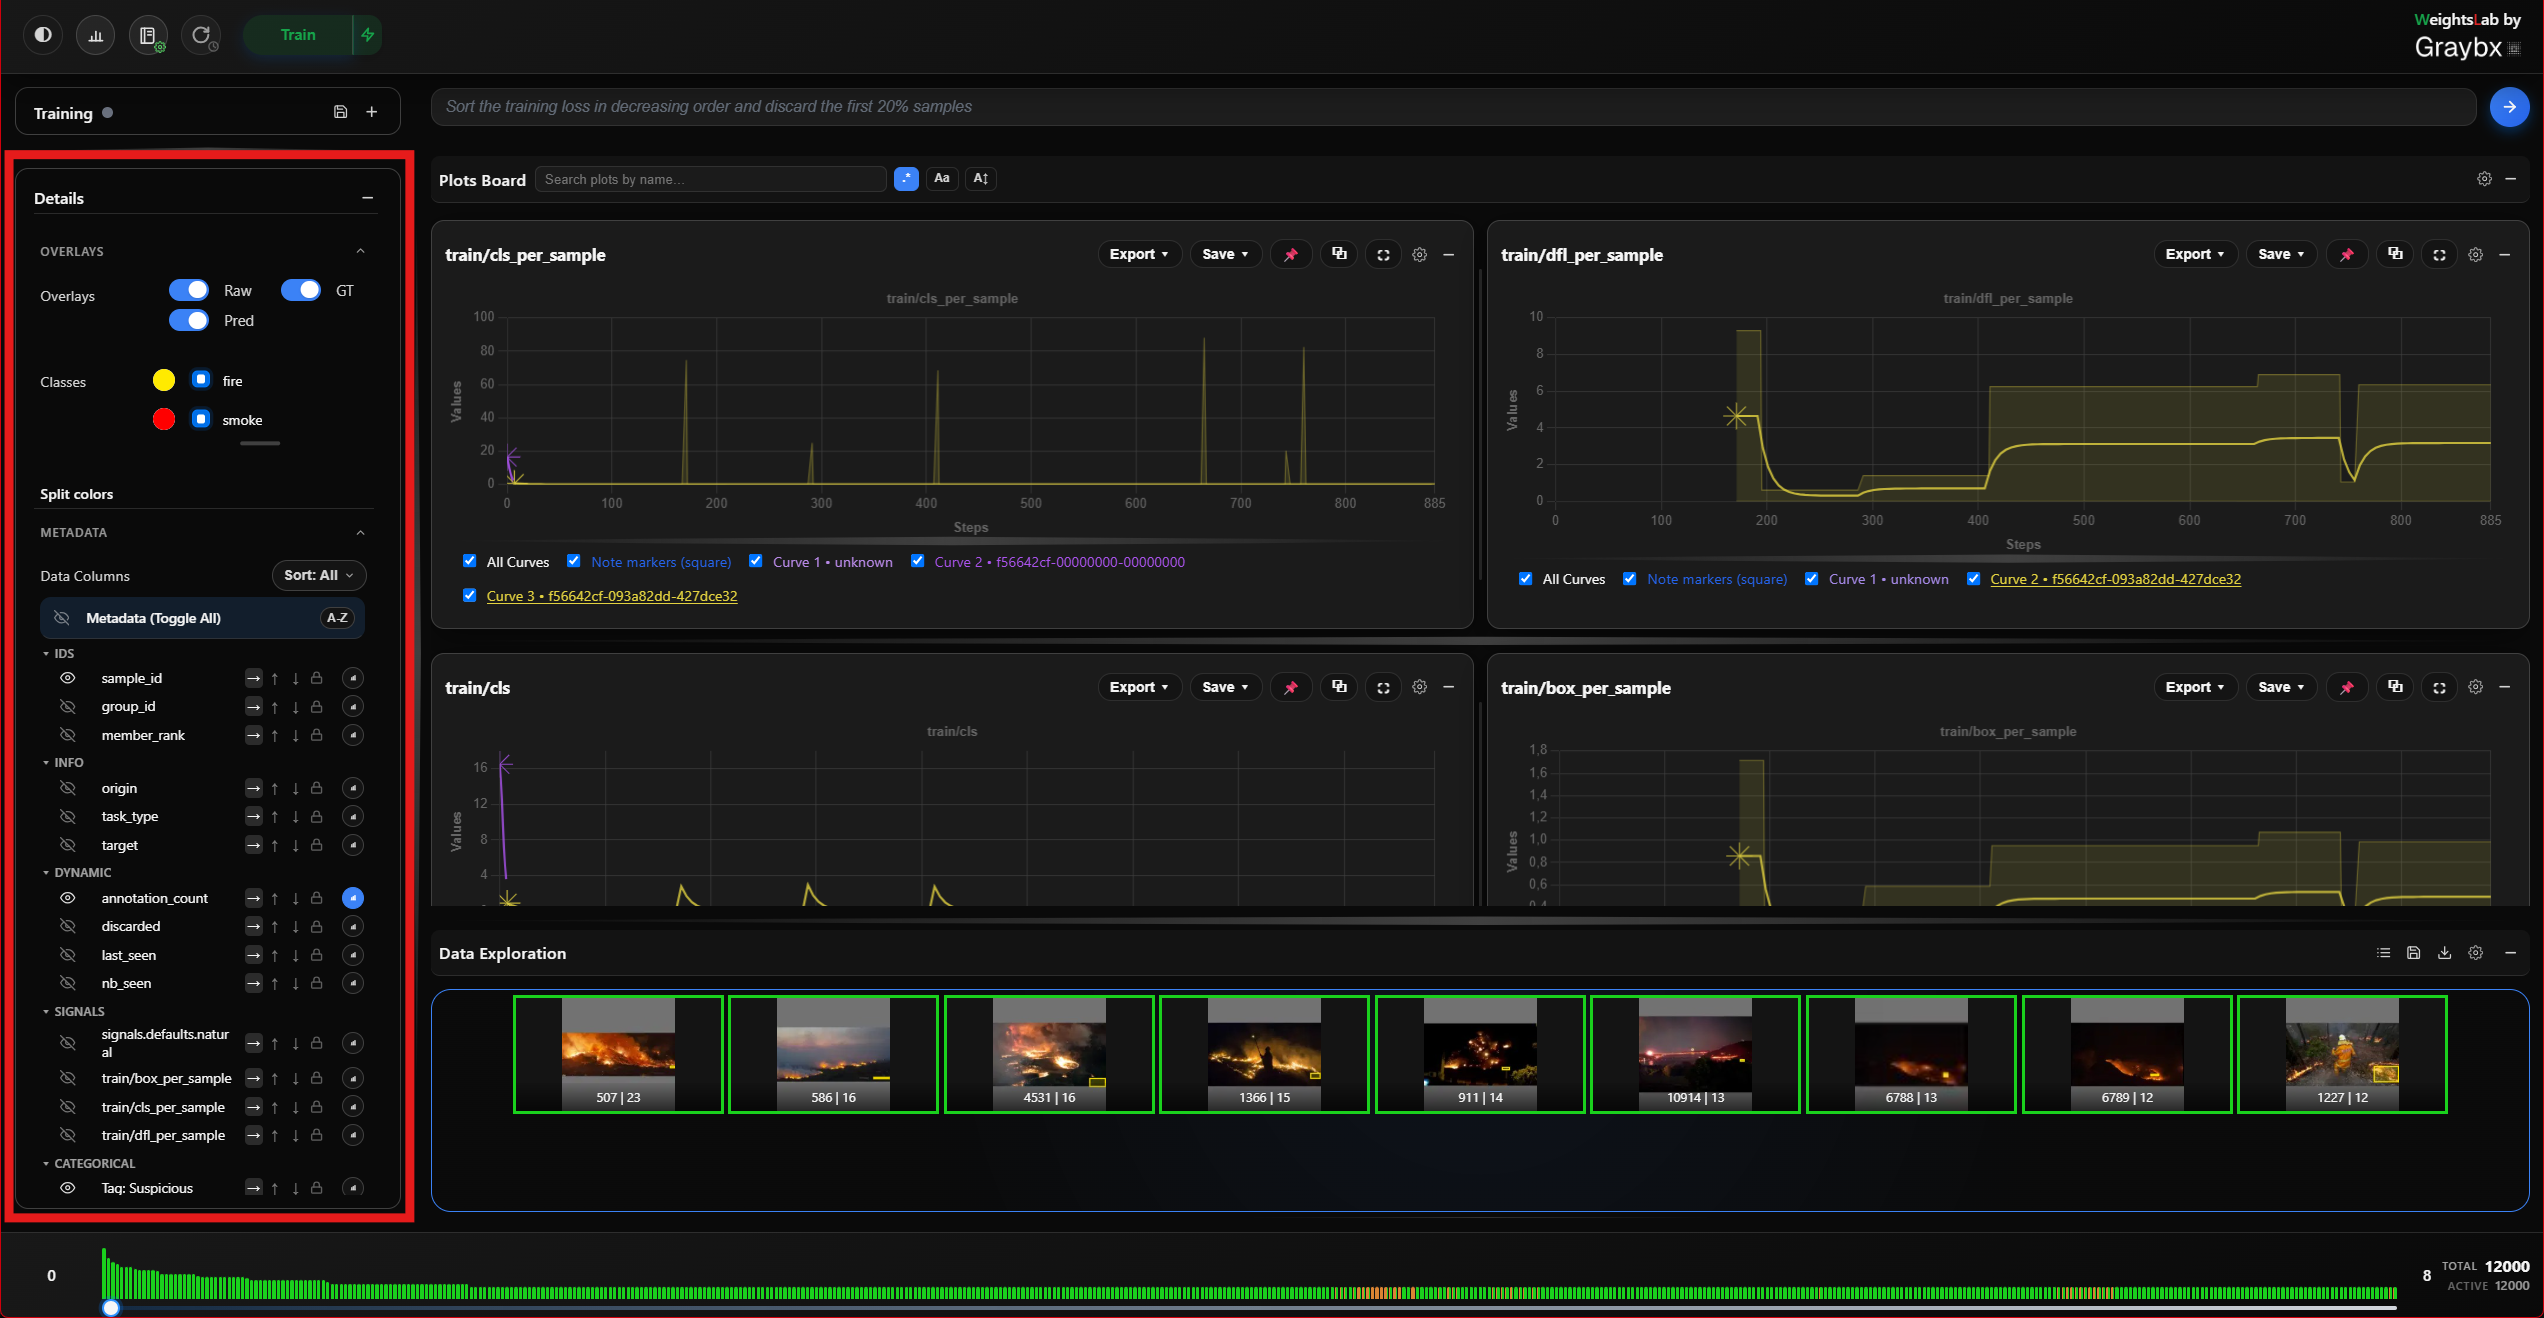
Grid settings, cell size and image resolution. Lower the resolution percentage on a big dataset: the grid renders far faster and the detail modal still loads full resolution.
Overlays, toggle raw, ground truth, and prediction layers on every thumbnail at once. Segmentation runs get a per-class list so individual classes can be shown or hidden.
Train / eval colours, the accent colours distinguishing train samples from eval samples in the grid.
Metadata fields, choose which columns appear on cells and as columns in the list view. Each field can also be turned into a histogram.
Data actions
Manual save, writes the current data state (tags, discards) to disk immediately rather than waiting for the next automatic save.
Export annotations, exports bounding boxes and segmentation masks to CVAT, Label Studio, or V7 for relabelling.
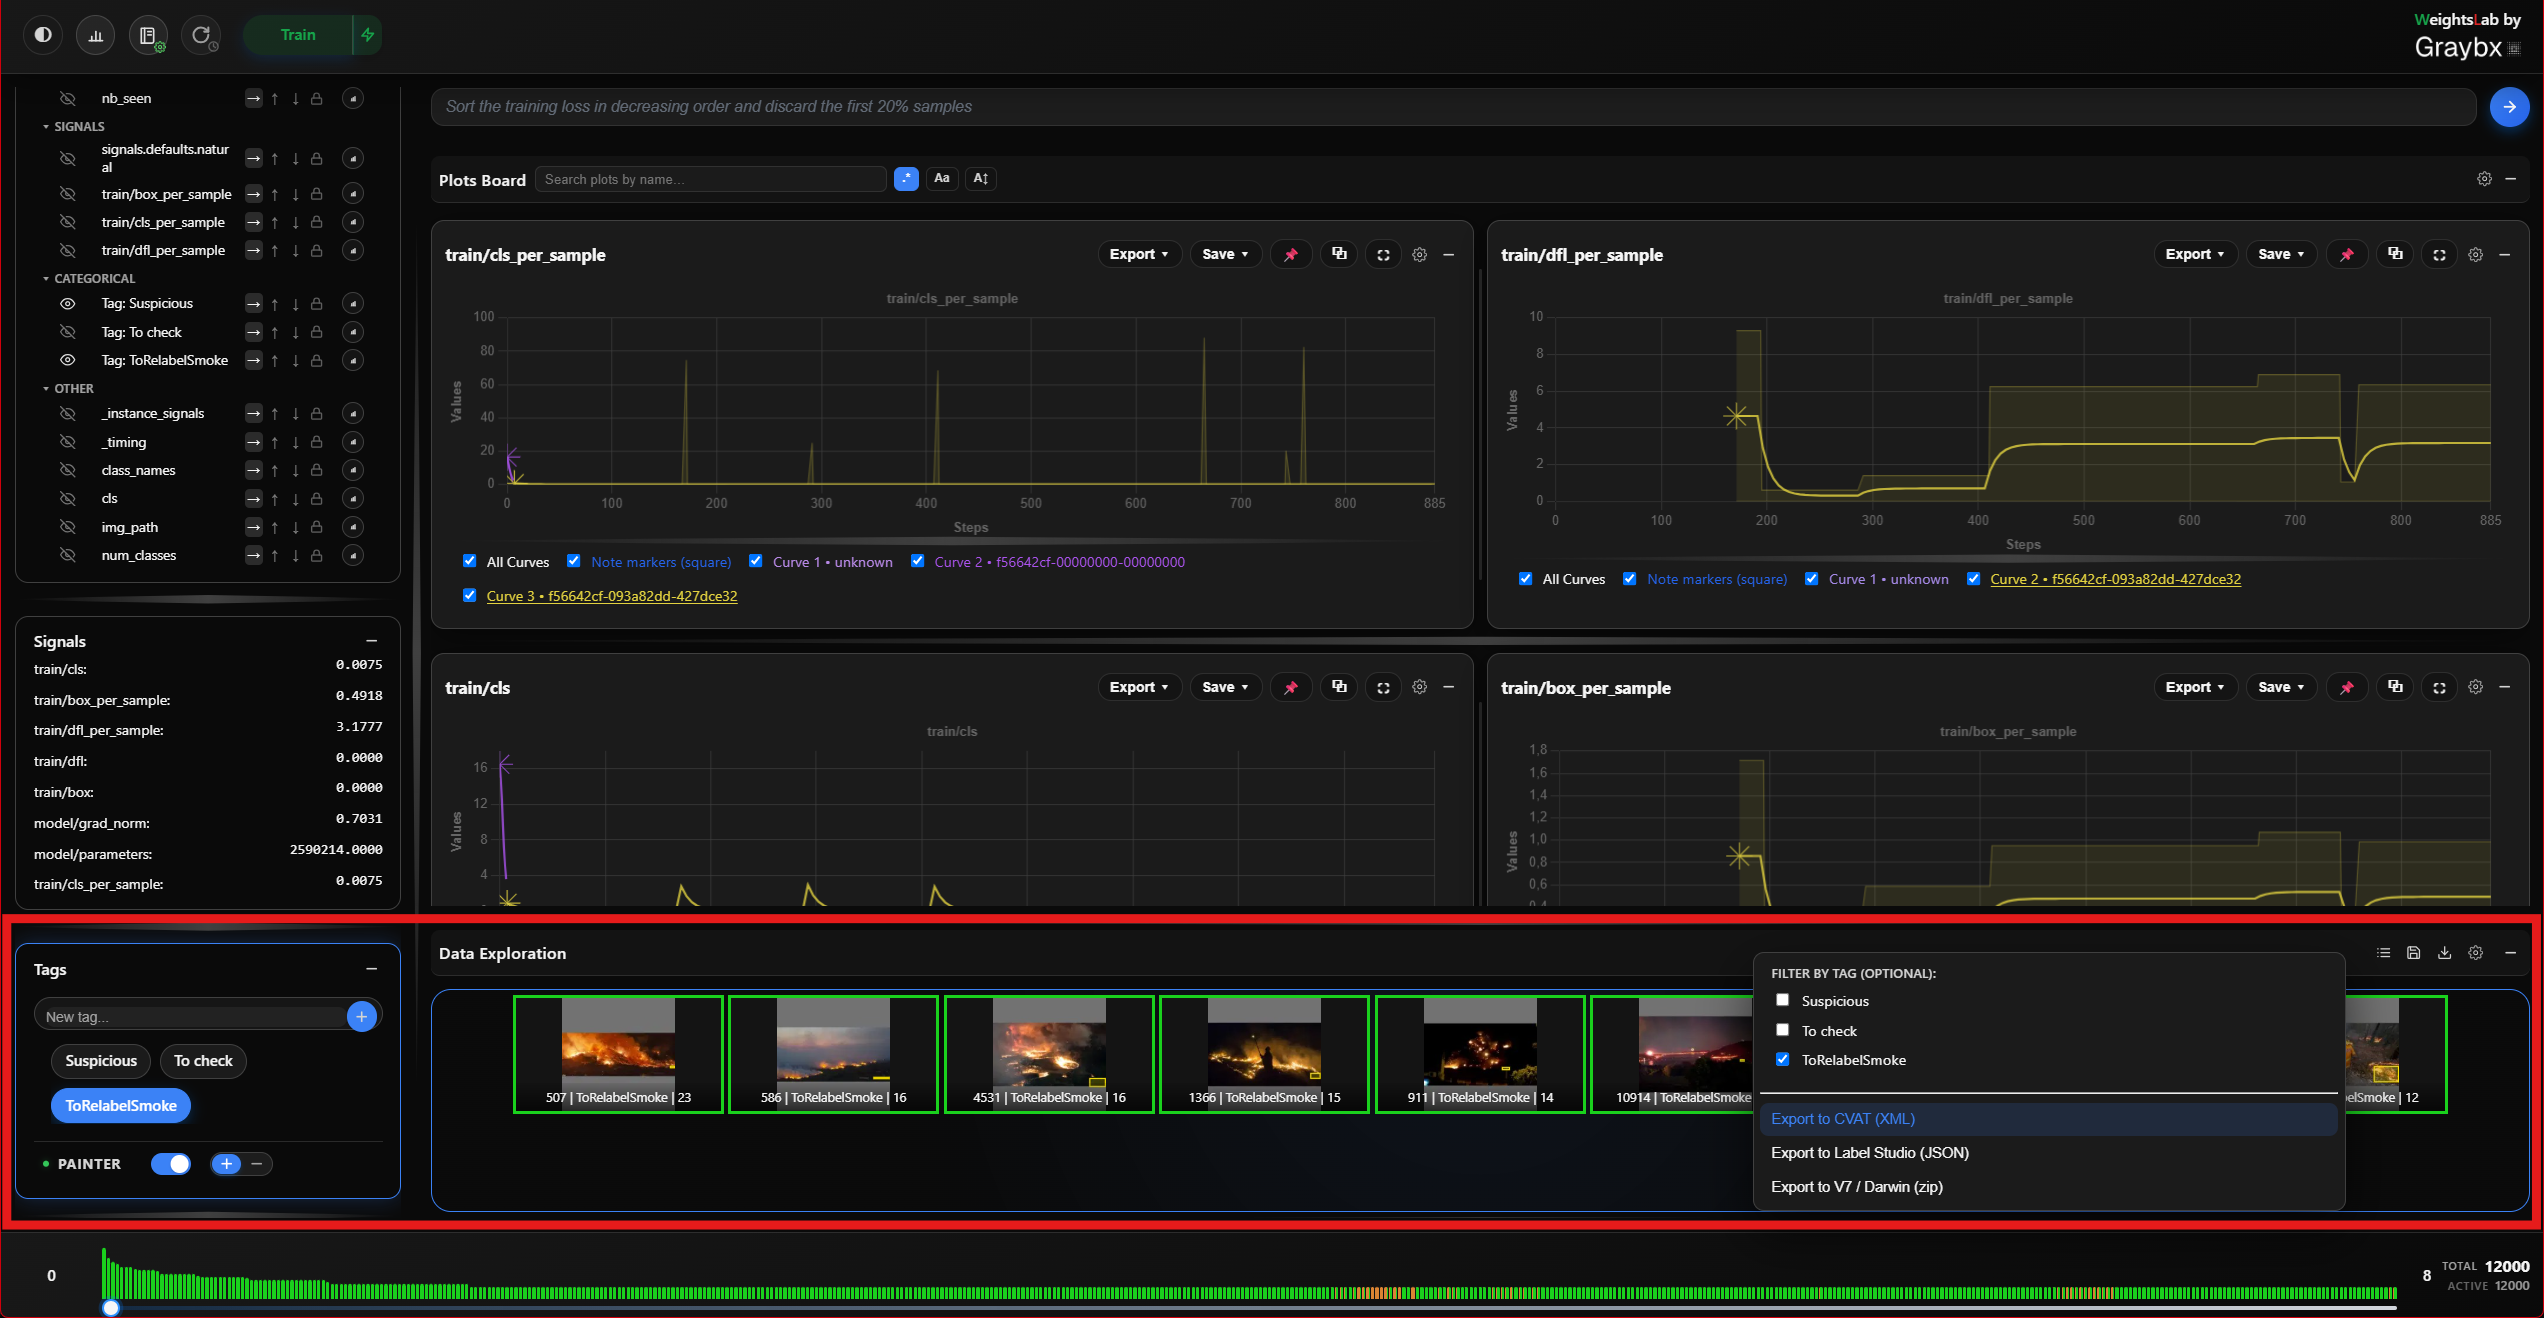
See Annotation Export for the formats and the round trip back.